![]()
![]()
![]()
![]()
|
|
|
|
|
>>> View: Graph View
>>> Alt+V
>>> ![]()
The Graph View function displays a View of the Active Dataset (the Dataset displayed in the Dataset Selector on the Toolbar) with the data shown in Graph mode. When initially displayed the Graph Display will show blank axes. Use the Channel Legend Buttons to the right side of the screen to select the channels to be graphed. If the number of channels exceeds the space available to show all the buttons the up and down arrows at the bottom of the buttons can be used to scroll through all the channel buttons.
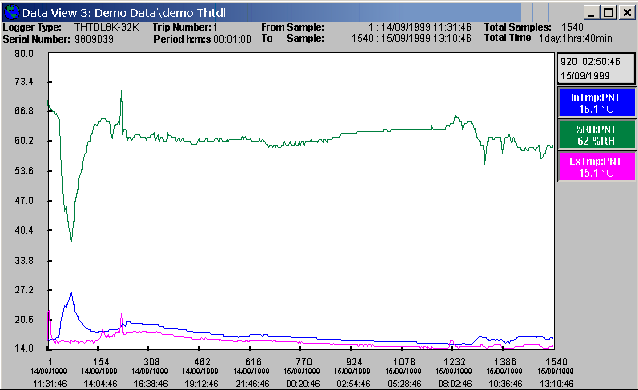
A number of Zoom, Scale, Pan and Display functions are available in this mode. These are selected from a popup menu that is displayed on a right mouse click with in the Graph Plot area of the display. These functions include:
Zoom to full |
Zooms the graph out to display the whole dataset. This will clear any blocks that may have been set |
Zoom In |
Decreases the number of samples displayed on the graph |
Zoom Out |
Increases the number of samples displayed on the graph |
Redraw Graph |
Sometimes Message boxes and other Data views can partially erase graphs as they pass over them. This option is used to redraw the graph if this occurs |
Percentage Scale |
It can be difficult to compare two plots with vastly different magnitudes on the one graph. (eg if you are comparing Humidity 45%RH to 65%RH and Pressure 1004hPa to 1016hPa both plots will show as straight lines when compared on a normal graph.) The Percentage Scale option can be used to normalize the data so that the range of each plot will be shown as 0% to 100%. This allows data of dissimilar range and magnitude to be compared easily. Absolute values for the plots can still be seen on the Channel Legend Buttons. |
Auto Scale |
The OmniLog Application choses a Scale and range that best fits all the data displayed |
Manual Scale |
The user can enter High Scale (maximum value on the Y axis) and Low Scale (minimum value on the Y axis).Any data that falls outside these limits will be ignored by the graph. |
Pan |
This displays a sub menu of Pan options including:
|
|
|
|
|
Values View |
Sets the Dataset View to Values only. |
Statistics View |
Sets the Dataset View to Statistics mode only. Any blocks set in the previous values mode will be reflected in the new Statistics View |
Graph View |
Sets the Dataset View to Graph mode only. Any blocks set in the previous values mode will be reflected in the new Graph View |
Values and Statistics |
Sets the Dataset View to a combination of both Values and Statistics modes |
Graph and Values |
Sets the Dataset View to a combination of both Graph and Values modes |
Graph and Statistics |
Sets the Dataset View to a combination of both Graph and Statistics modes |
A block can be set in Graph View by clicking on any point in the plot area of the graph and dragging the block marker to a second point. When the mouse button is released after the drag is finished, the block is marked and the graph display zooms in to this block. To clear the block markers use Zoom to Full from the Graph Right Click popup menu. A block mark performed in Graph mode will be reflected in Values and Statistics mode.